PLY mesh support #24961

**Warning:** The PR changes exising API.

Fixes #24960
Connected PR: [#1145@extra](https://github.com/opencv/opencv_extra/pull/1145)

### Changes
* Adds faces loading from and saving to PLY files
* Fixes incorrect PLY loading (see issue)
* Adds per-vertex color loading / saving

### Pull Request Readiness Checklist

See details at https://github.com/opencv/opencv/wiki/How_to_contribute#making-a-good-pull-request

- [x] I agree to contribute to the project under Apache 2 License.
- [x] To the best of my knowledge, the proposed patch is not based on a code under GPL or another license that is incompatible with OpenCV
- [x] The PR is proposed to the proper branch
- [x] There is a reference to the original bug report and related work
- [x] There is accuracy test, performance test and test data in opencv_extra repository, if applicable
      Patch to opencv_extra has the same branch name.
- [x] The feature is well documented and sample code can be built with the project CMake
2.3 KiB
Point cloud visualisation
| Original author | Dmitrii Klepikov |
| Compatibility | OpenCV >= 5.0 |
Goal
In this tutorial you will:
- Load and save point cloud data
- Visualise your data
Requirements
For visualisations you need to compile OpenCV library with OpenGL support. For this you should set WITH_OPENGL flag ON in CMake while building OpenCV from source.
Practice
Loading and saving of point cloud can be done using cv::loadPointCloud and cv::savePointCloud accordingly.
Currently supported formats are:
- .OBJ (supported keys are v(which is responsible for point position), vn(normal coordinates) and f(faces of a mesh), other keys are ignored)
- .PLY (all encoding types(ascii and byte) are supported with limitation to only float type for data)
@code{.py} vertices, normals = cv2.loadPointCloud("teapot.obj") @endcode
Function cv::loadPointCloud returns vector of points of float (cv::Point3f) and vector of their normals(if specified in source file).
To visualize it you can use functions from viz3d module and it is needed to reinterpret data into another format
@code{.py} vertices = np.squeeze(vertices, axis=1)
color = [1.0, 1.0, 0.0] colors = np.tile(color, (vertices.shape[0], 1)) obj_pts = np.concatenate((vertices, colors), axis=1).astype(np.float32)
cv2.viz3d.showPoints("Window", "Points", obj_pts)
cv2.waitKey(0) @endcode
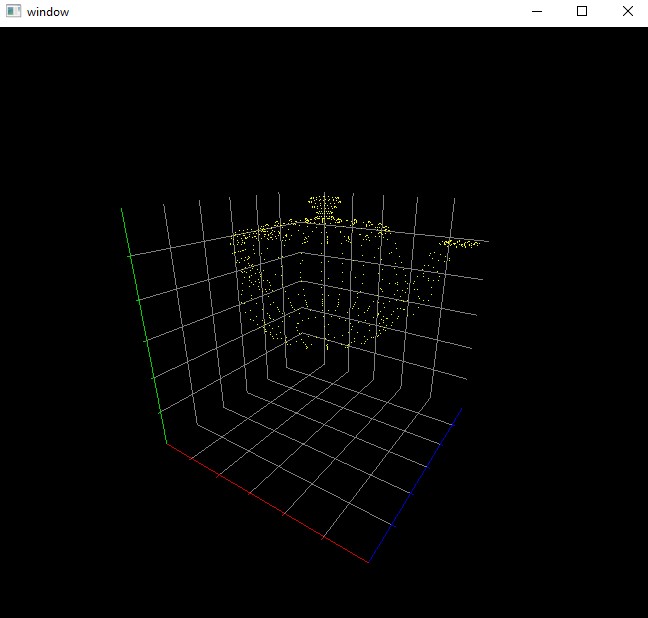
In presented code sample we add a colour attribute to every point Result will be:
For additional info grid can be added
@code{.py} vertices, normals = cv2.loadPointCloud("teapot.obj") @endcode
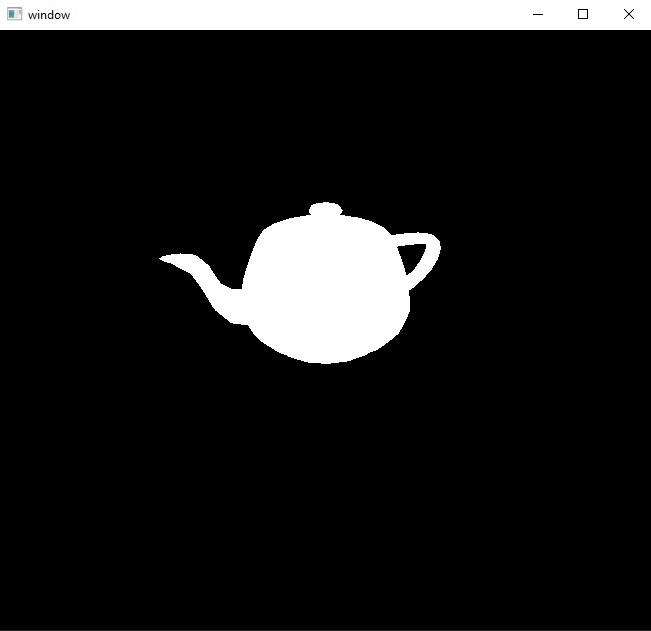
Other possible way to draw 3d objects can be a mesh. For that we use special functions to load mesh data and display it. Here for now only .OBJ files are supported and they should be triangulated before processing (triangulation - process of breaking faces into triangles).
@code{.py} vertices, indices = cv2.loadMesh("../data/teapot.obj") vertices = np.squeeze(vertices, axis=1)
cv2.viz3d.showMesh("window", "mesh", vertices, indices) @endcode


