OpenCV provides a tracing facility for efficient development of Computer Vision Applications.
Tracing framework is built-in directly into the OpenCV source code. To use it, you only need to compile and link your application with modern version of OpenCV.
The tracing is enabled by default at compile time. But it's not activated by default at runtime, because it impacts the performance. It's activated when the environment variable OPENCV_TRACE is set (OPENCV_TRACE=1) or when OpenCV-based app is running within a specialized profiling software supporting Instrumentation and Tracing Technology (ITT).
OpenCV tracing relies on the ITT API, an Intel®-provided profiling framework (https://software.intel.com/en-us/articles/intel-itt-api-open-source).
You can analyze data generated via the ITT API backend using these tools:
- Intel® VTune™ Amplifier
- Intel® Single Event API (Intel® SEAPI)
An alternative to the ITT-based instrumentation, is to trace the OpenCV calls in the compact machine-readable text form. This approach is useful for cases when external tools (like Intel® VTune™ Amplifier) cannot be used or you are willing to parse and analyze traces in some custom way.
Notice that only performance relevant set of the OpenCV functions is traced to avoid bloating of the timeline view.
Using VTune™ performance profiler tool
Tool site: https://software.intel.com/en-us/intel-vtune-amplifier-xe
The handiest way to collect a trace is to run your application under control of Intel® VTune™ Amplifier. With VTune™ you can correlate your OpenCV activity with various important metrics for CPU and GPU. Finally, VTune™ captures most Intel APIs beyond OpenCV, for example OpenCL. So with these tools you can see when OpenCV calls are translated into OpenCL tasks.
Just run analyzed OpenCV Application under Intel® VTune™ Amplifier with enabled "Analyze user tasks" option.
Result view ("Platform" tab):
Using Intel® SEAPI
Tool Site: https://github.com/01org/IntelSEAPI
Intel® SEAPI is the translator of itt_notify calls into several OS specific and third party tracing formats.
- Download (or clone) project repository files
- Build tool. Refer to tool's site documentation how to build it.
- Run OpenCV Application via Intel® SEAPI wrapper to collect tracing information and generate google trace file in json format:
python <IntelSEAPI path>/runtool/sea_runtool.py -o ocv-trace -f gt ! ./bin/cpp-example-application_trace
- You can open result file (ocv-trace.pid-NNNNN.zip/.json) via Google Chrome / Chromium browser: open URL "about://tracing"
High level trace results:
"Process" region:
images/trace-frame-process.png
View with detailed traces:
There is an example result file (.zip / .json) with collected Application calls traces via Intel® SEAPI tool (to play with it, just open "about://tracing" URL and load this file)
Alternative collection of trace information for custom analyzing
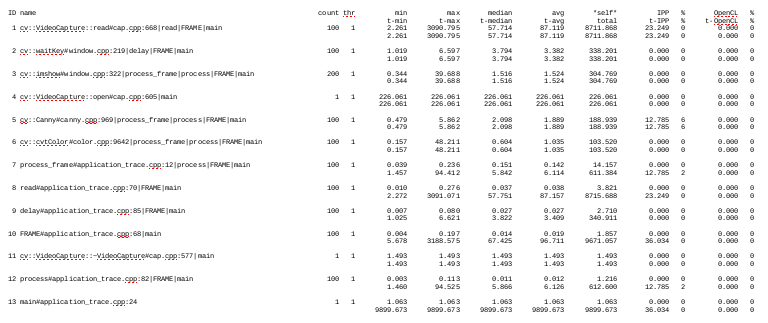
You can collect trace of the OpenCV calls in the compact machine-readable text form for custom analysis.
Run application with OPENCV_TRACE=1 environment variable. You will receive trace dump in a set of OpenCVTrace.txt files. You can control location and name of result trace dump files via OPENCV_TRACE_LOCATION environment variable.
You can use OpenCV-bundled trace analyzer tool: "trace_profiler.py" (located in modules/ts/misc) to get highlighted calls of your application.
Tracing runtime options
Runtime options can be specified via environment variables.
OPENCV_TRACE- enables OpenCV tracing. By default tracing is turned off. It automatically enables on active ITT backend on startup.OPENCV_TRACE_LOCATION- storage path to store OpenCV trace.OPENCV_TRACE_DEPTH_OPENCV- specify trace depth of OpenCV functions- 0 - limit is disabled
- 1 - trace OpenCV entry points only, without inner details (default)
OPENCV_TRACE_MAX_CHILDREN- limit number of traced children (useful to ignore functions with large loops)OPENCV_TRACE_MAX_CHILDREN_OPENCV- limit number of traced children for OpenCV callsOPENCV_TRACE_SYNC_OPENCL- forceclFinishcalls in the end of OpenCV regions (performance impact, default value is0)
Tracing macro list
To profile your application, you can use the following macros, the most important of which are CV_TRACE_FUNCTION() and CV_TRACE_REGION():
CV_TRACE_FUNCTION()- the macro is already inserted into many OpenCV functions. If you want to trace calls of your own function, put it in the beginning of the function body.CV_TRACE_FUNCTION_SKIP_NESTED()- trace current function, but skip all nested regions. Use this for non-critical functions (like data load or validation) to reduce trace log.CV_TRACE_REGION("myregion")- C++ scoped region trace.CV_TRACE_REGION_NEXT("next_step")- change current region (in the same C++ scope). Useful to trace region consequences (step1/step2/../stepN).CV_TRACE_ARG(arg)- trace argument value (or other variable). Supporteddouble/int64/int/const char*data types. Currently tracing of argument values is supported for ITT backend only.CV_TRACE_ARG_VALUE(width_id, "width", size.width())- expanded version ofCV_TRACE_ARG.
For usage example please refer to OpenCV example (application_trace.cpp) with using of OpenCV Tracing API.
- Home
- Deep Learning in OpenCV
- Running OpenCV on Various Platforms
- OpenCV 5
- OpenCV 4
- OpenCV 3
- Development process
- OpenCV GSoC
- Archive
© Copyright 2019-2025, OpenCV team
